In Short
S4Explorer is a S/4 HANA Fiori app for exploring and analyzing S/4 HANA business content.
With S4Explorer, architects, consultants, developers and system administrators can quickly find and understand S/4 HANA objects like CDS views, table functions and OData Services. S4Explorer gives you quick and clear insights in how CDS objects work, how they support APIs and services, and visualize interconnections between all these aspects.
This series of blogposts highlights the main features of S4Explorer.
The first installment of the series covered how Smart Search helps you to quickly find the CDS objects you’re interested in. In this second issue, we focus on the CDS Structure Diagram.
CDS Structure Diagrams visualize CDS objects as compact diagrams, letting you grasp the design of even complex CDS objects in a glance. This way, you can quickly focus on aspects relevant to you, and drill down on only those details you need. Achieving similar insights using SAP Tools – like the ABAP eclipse perspective – is possible, but only at the expense of a time-consuming process of scanning hundreds or even thousands of lines of CDS code.
This post demonstrates how to access CDS Structure Diagrams and introduces some of their key concepts and functionalities to use them. In a forthcoming post we’ll take a deep dive to show you some of its more advanced features.
The S4Explorer Structure Diagram – Overview
Before we get into the what, let’s first discuss the how. Consider the screenshot below:
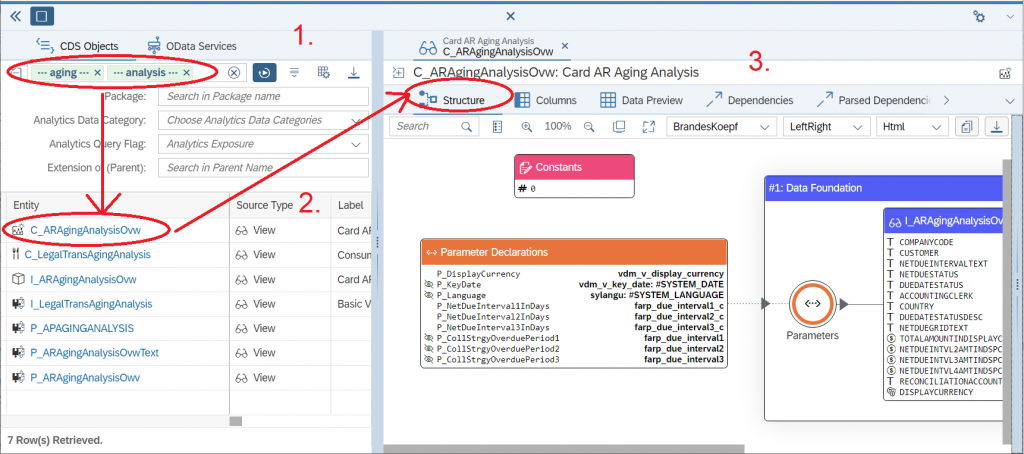
How to access S4Explorer Structure Diagrams
- In the previous installment of the series we discussed how S4Explorer Smart Search lets you find CDS objects. The screenshot shows how both the search terms
agingandanalysiswhere entered and the search was executed. - Below the search form we see the table with 7 query results. For each result, we see the name of the object as well as an icon, which reveals some information about the type of object. First we see an analytical query called
C_ARAgingAnalysisOvw, then a consumption viewC_LegalTransAgingAnalysis, and then a Cube calledI_ARAgingAnalysisOvw. The icons on the remaining 4 results indicate that these are intermediate views. Now, as you can see in the Source Type column of the results table, from a CDS perspective, all these object are all just “views”. But each has various annotations that add specific functionality or designate a particular intention of usage – something which cannot be reliably derived from the object name. S4Explorer tries to choose an appropriate icon so you can quickly decide which of the search results best fits your purpose. - Clicking the
C_ARAgingAnalysisOvwlink in the Entity column of the results table opens a tab page in the S4Explorer work area, showing the details of theC_ARAgingAnalysisOvwCDS Object. The CDS object detail page itself has many subtabs, each showing a different aspect of the CDS object. The first subtab is labeled “Structure” and shows the Structure diagram – the main topic of this installment.
CDS Structure diagrams are mostly applicable to views and view-like objects: DDIC-based views, view entities, projection views, and view extensions. This includes the various finer classifications that may be controlled through @Analytics.dataCategory annotations, such as Cubes and Dimensions, or analytical queries assigned by a @Analytics.query annotation.
Visualization: Parts, Relationships, Groups
Before we can explain how to properly read CDS Structure diagrams, we need to introduce a bit of general terminology. S4Explorer Structure diagrams visualize the features of a CDS-object as a collection of structural parts, and also shows how these parts are connected to work together. Some parts are more closely related to each other than others, and grouping them facilitates readability and insight.
In terms of visualization,
- A part is represented by a so-called node: they appear as a circlular or rectangular shape, and include a title that describes the part. A node may have several attributes that further describe the part. Shapes representing parts typically also have an icon that conveys information about the meaning or role of the part. They also have a color that in some way distinguishes them from parts of another type.
- A relationship between parts is visualized as a line, which may have a arrowhead to indicate the direction of the relationship. The linestyle – solid, dashed, dotted, and so on – indicates some quality about the relationship
- A group appears as a titled and bordered rectangular area that contains at least one but typically multiple parts.
The following screenshot illustrates these concepts:
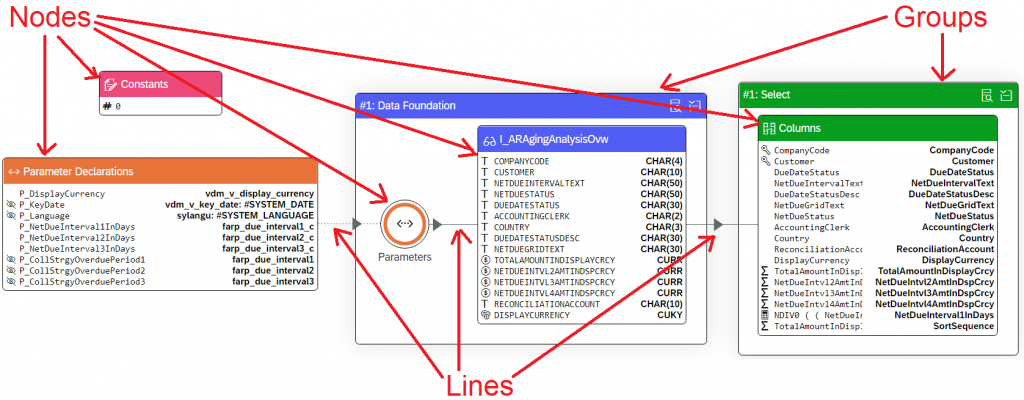
Diagram terminology: Nodes, Lines, and Groups
User Interface Elements
The different parts that appear in the CDS Structure diagram may be clicked and selected to reveal one or more action buttons:
- Typically, a details action button is available, which can be clicked to reveal a popup containing detailed information about the element. Usually this will be a snippet of CDS code corresponding to that particular element.
- If applicable, a links action button is available which may show one ore more links that let you drill down further on that particular element. Clicking the link typically opens a new tab, especially for the corresponding element.
In addition to the visualization area, the structure diagram also has a toolbar and a settings panel:
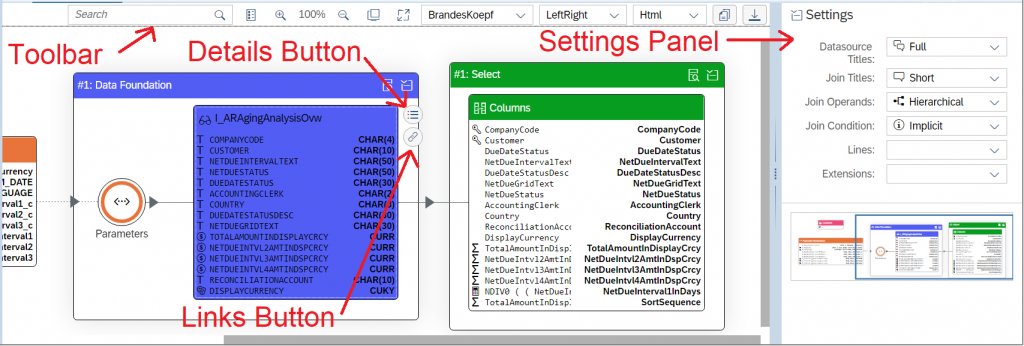
CDS Structure Diagram UI
- The diagram toolbar appears at the top of the diagram and lets you control purely visual aspects of the diagram: things like zoom level and layouting algorithm. In addition, the toolbar has buttons that let you copy the diagram to the clipboard, as well as a button to download the diagram. This makes it easy to share diagrams across applications.
- The settings panel appears in a sidebar to the right of the diagram and contains a user interface to control aspects about the type of information and the level of information detail shown in the diagram. In addition, the settings panel contains a so-called “map” component, which shows a miniature of the diagram, and which makes it much easier to maintain an overview of the entire diagram, even when the diagram is (much) larger than the visible area on the screen.
How to read CDS Structure Diagrams
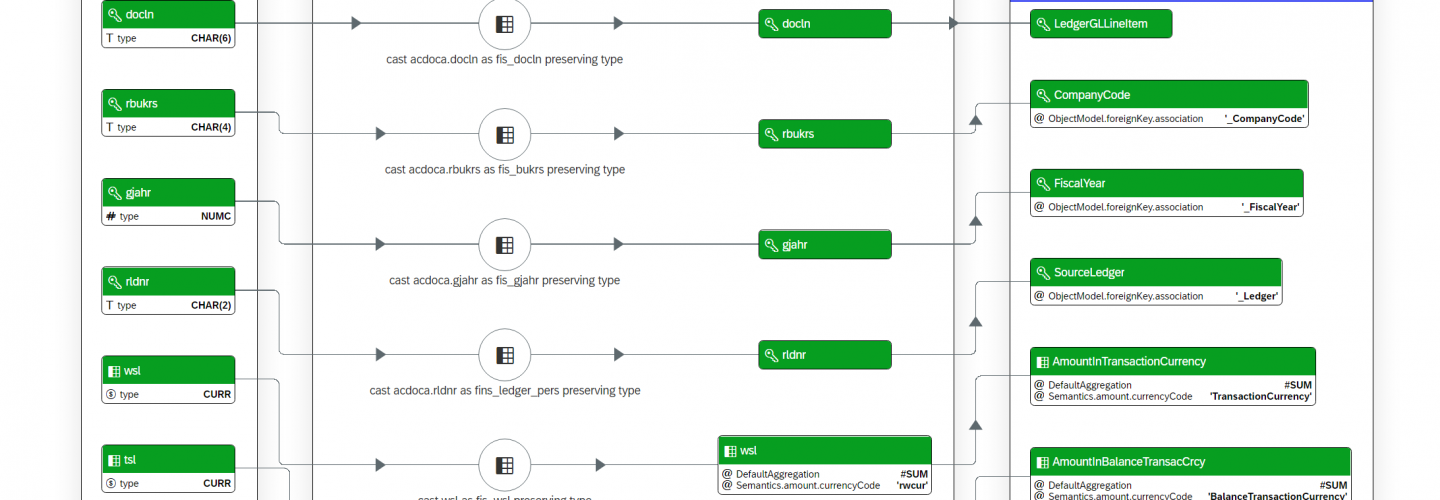
Now that we covered the basic features, lets take a closer look at the diagram content, and how it corresponds to the CDS code it represents. Let’s re-examine the C_ARAgingAnalysisOvw view introduced in the previous section. The view definition is rather simple, as might be expected from an analytical query: all sourcing of data and any transformations and operations (like joins, grouping etc) have already been handled one ore several layers deeper down in the virtual data model.
The CDS code that defines C_ARAgingAnalysisOvw runs just over 200 lines (6.53 KB). This may not sound like a lot, and by comparison to other views it isn’t. Still, for most screen sizes, it amounts to 4-5 pages to scroll through. And to understand the view, it’s not enough to simply scroll through the code – you need to at least scan for keywords and phrases to understand what it means in terms of functionalty.
Now consider its S4Explorer Structure diagram, in its default left-to-right layout:
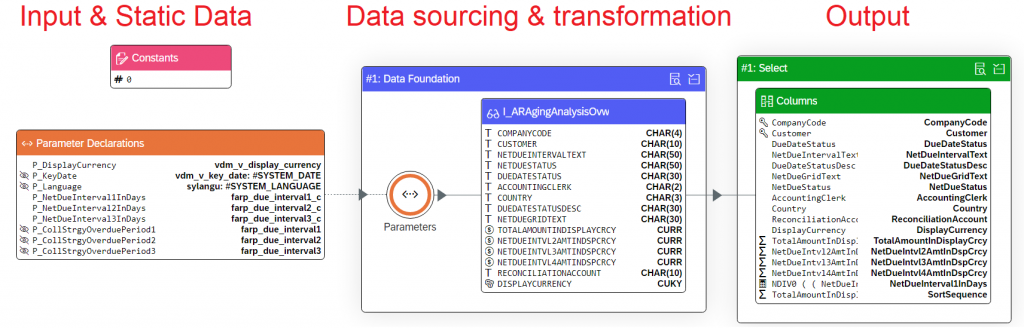
The S4Explorer Structure Diagram of the CDS view C_ARAgingAnalysisOvw
The full-scale diagram fits with ease, even on a non-hi resolution laptop screen. The image can be overseen in just one glance. But even if do you look at its individual parts, the layout suggests a natural explanation of how this view “works”: parameters are declared, and led into the underlying data source. This then yields a result dataset, where some calculations and aggregations are applied, which are then exposed as new columns of this view.
No more CDS Code?
Now, one may argue that this view is so simple that the diagram does not explain anything we didn’t know already. But that’s not entirely fair, as it underestimates the power of having this insight instantly, just with a single glance at the diagram.
One may also argue that the structure diagram hides important details that are available in full detail in the CDS code. However, the structure diagram still lets access this information: simply click on a particular part that interests you, and click the details action button to reveal its details.
The Structure Diagram is not meant as replacement for reading CDS code. Rather, it offers a way to clarify, and to guide you so you can quickly decide when and where you want to zoom into code details.
In addition, S4Explorer lets you access the full CDS source code as well: the Object detail page also includes a CDS source code tab which displays the full CDS source code and which includes features like syntax highlighting and code folding.
Parameter Declarations
In the structure diagram, parameter declarations are represented by a rectangular node with an orange header labeled “Parameter Declarations”. The Fiori “values” icon is used as a symbol for parameters.
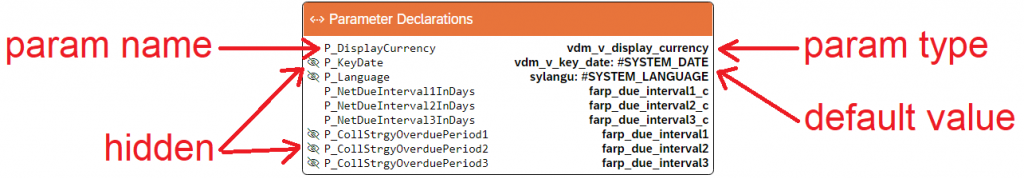
The parameter declarations list of the CDS view C_ARAgingAnalysisOvw as seen in the S4Explorer Structure Diagram.
Inside the node, attributes are used to list each and every parameter declaration. The parameter name appears on the left, and its declared type (which is usually a domain name) on the right.
A Fiori “hide” icon appears before the parameter name if the parameter is annotated with a @Consumption.hidden: true annotation.
Parameter declarations may have a @Environment.systemField annotation, which is a sort of mechanism to provide parameters with a default value assignment. If such an annotation exists, then its type is followed by a colon and the assigned value.
All in all this provides a compact way to present key features about the parameter declarations in one place. For comparision, here’s the equivalent CDS source code for the parameterlist:
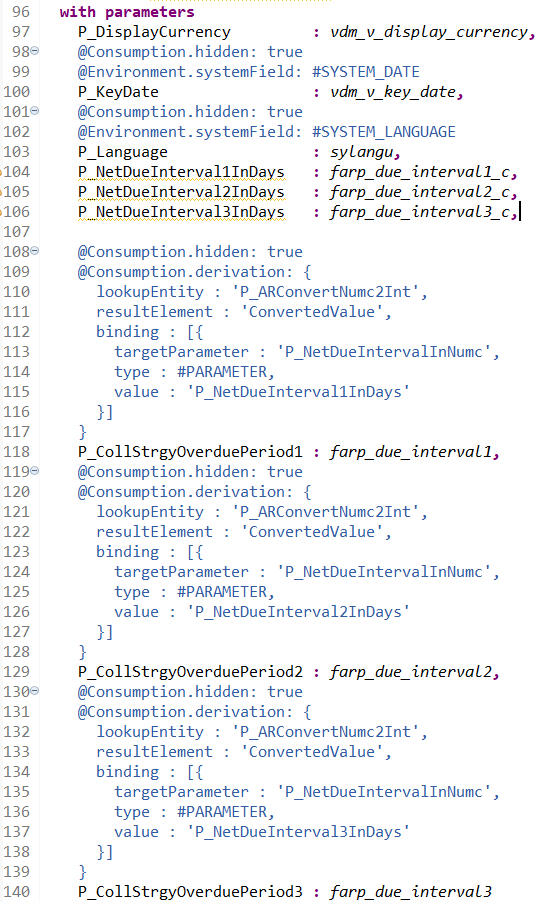
The CDS code of the parameter declarations list of the CDS view C_ARAgingAnalysisOvw.
Data Foundation
In the structure diagram, the Data Foundation is a group of elements that comprises all CDS clauses within one SELECT-statement that have to do with data sourcing and flow. It includes the FROM-clause, and – if present – any JOINs, GROUP BY-clause and HAVING-clause. The Data Foundation does not include the projection list. (The projection list is discussed in detail in the next section).
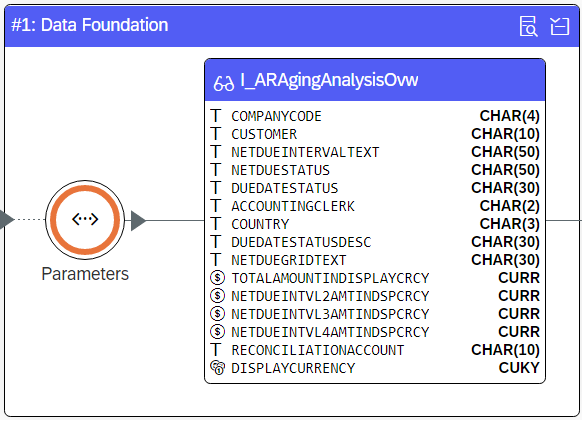
S4Explorer Structure Diagram: The Data Foundation
The Data Foundation group has a bright blue header and is labeled “#1: Data Foundation”. The “#1” indicates an ordinal position: a CDS view may consist of multiple SELECT-statements that are combined by a UNION-operator. In the S4Explorer Structure diagram, each individual SELECT-statement would get its own data foundation (and projection list).
Datasource: I_ARAgingAnalysisOvw
The Data Foundation always contains at least one datasource. In terms of CDS code, this would be whatever object is stated in the CDS FROM-clause. This might be any kind of column object: a view, a base table, or a table function. In the CDS structure diagram, these column objects are always represented by a rectangular node, with a colored title:
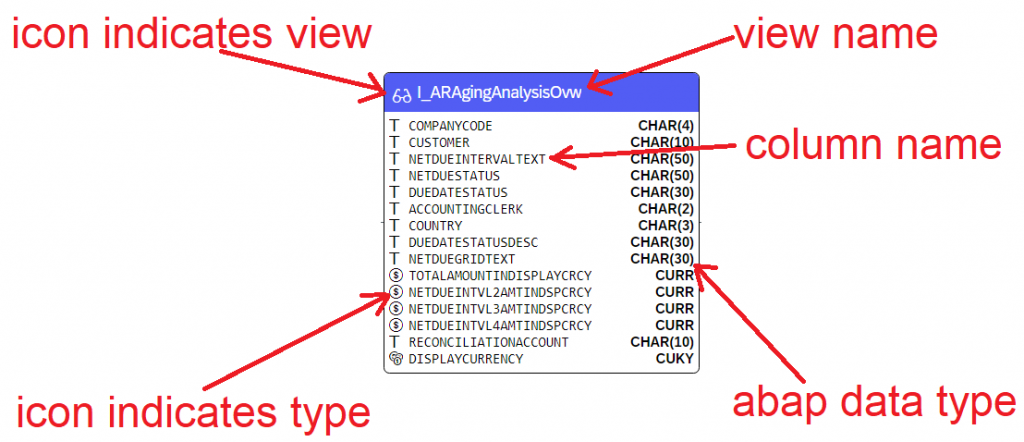
The I_ARAgingAnalysisOvw datasource
The icon in the data source title offers some information about what type of data source it is. In this case, the Fiori “display” icon indicates that this data source is a CDS view. The Object’s raw name appears behind the icon, in this case, the CDS View called I_ARAgingAnalysisOvw. You can control the verbosity of the datasource titles from the settings panel. In “short” format, only the alias of the datasource is shown (if it exists, otherwise just the object name). In “long” format, a full <object name> as <alias> format is used.
Inside the node, attributes represent a selection of the object’s columns. Only those columns that are actually referenced somewhere in the CDS object are listed. Each column is represented by its upper case column name (the reference name). The icon that appears before the column name indicates its data type. A more full definition of the column’s data type appears right of the column name.
Drill-down on Datasource
Because I_ARAgingAnalysisOvw is itself a CDS view, we can drill down directly to it: simply click the node to reveal its action buttons, and then click the links button to reveal a link to I_ARAgingAnalysisOvw:
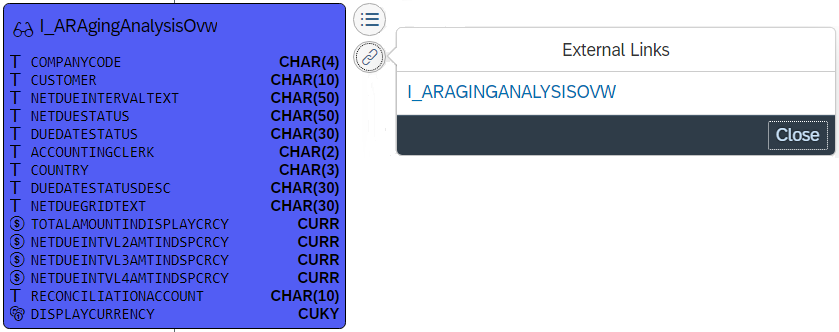
Drilldown on the I_ARAgingAnalysisOvw datasource.
Clicking the link will open the object detail page for I_ARAgingAnalysisOvw, and from there you can explore its structure diagram, or any of its other aspects. The new object detail page opens in its own tab, so you can always revisit the previous diagram.
Parameter Assignments
We already discussed how the C_ARAgingAnalysisOvw declares parameters. But the I_ARAgingAnalysisOvw view upon which C_ARAgingAnalysisOvw is based, also declares its own parameters. So in order to use it, values must be passed and assigned to these parameters. The corresponding CDS code is shown below:
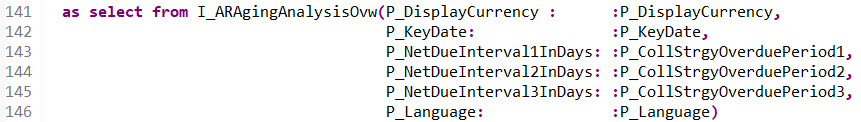
CDS code for Parameter assignment to I_ARAgingAnalysisOvw as used in C_ARAgingAnalysisOvw
In the CDS Structure diagram, parameter assignments are represented by a circular node, which is simply labeled “Parameters”. It has the same orange color and values icon as used for the parameter declarations list. Parameter assignment nodes have a solid line connecting it to the datasource to which the parameters are passed.
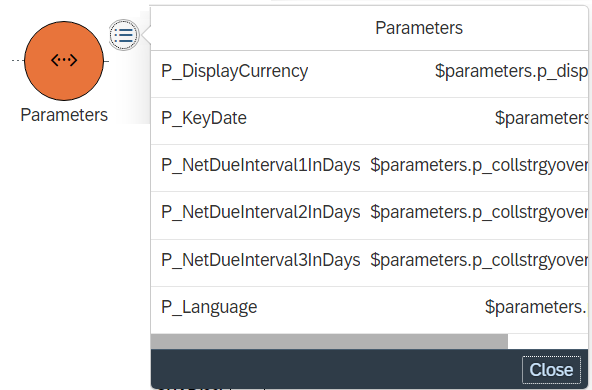
Representation of parameter assignment in the CDS structure diagram showing assignment details
Parameter assignment nodes are considered to be a detail that “belongs to” the datasource. For this reason, they do not get a separate label or a rectangular node with attributes. By selecting the node and clicking the Details action button, you can inspect the assigment in detail. Clicking it reveals a popup showing the datasource’s parameters on the left, followed by the assigned expression on the right.
In the case of C_ARAgingAnalysisOvw we see that it passes its own parameters to the parameters of the I_ARAgingAnalysisOvw datasource. This is a common pattern, but there are many instances where constants are passed to parameters, or where the view’s declared parameters are used elsewhere, such in a WHERE-clause. We will discuss and demonstrate examples like those in forthcoming posts on the CDS structure diagram.
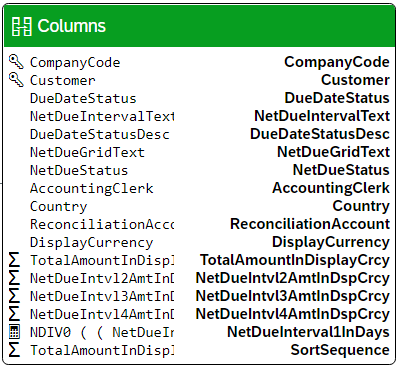
Select group
The Select-group represents all “output” exposed by the current view. It appears as a group with a green header, labeled “#1: Select”. Like with the Data Foundation, the “#1” indicates an ordinal number, as there could be multiple SELECT-statements in one view definition.
The Select-group of the CDS structure diagram
In this case, the Select-group contains only one node labeled “Columns”. This represents the columns defined by the view. The C_ARAgingAnalysisOvw does not expose any associations, hence none are visible here. Views that do expose associations show their associated datasources in the Select-group.
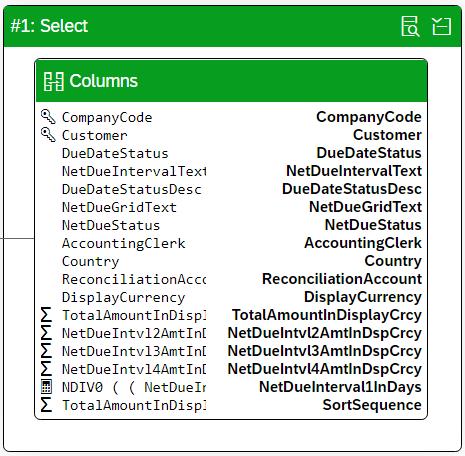
The Columns Node
The Columns node is a rectangular with a green header, just like the Select-group. It contains attributes to represent the columns defined by the current view. For each column, the expression is shown on the left, followed by the column name.
The columns node of the CDS Structure diagram shows all columns defined by the CDS view
Column expressions can grow very long, and may appear truncated in the diagram. But you can always review the full expression by selecting the Columns-node, and clicking its details action button. This will show a popup that reviews the full column expression.
Some columns are “special” and marked with an icon:
- If the view declares the column to be a key column, then that column will always get a Fiori “key” icon. In the example, this is the case for the
CompanyCodeandCustomercolumns. - If the column is annotated with a
@DefaultAggregationannotation, then an icon is shown to indictate what aggregate function is applied. In this example, theTotalAmountInDisplayCrcycolumn is annotated with@DefaultAggregation: #SUMwhich is visualized with the Fiori “sum” icon. TheNetDueIntervalInDayscolumn is annotated with an aggregation formula, which is why it gets a Fiori “simulate” icon. - Columns that are not defined as simple projections or cast expressions are marked with a Fiori “syntax” icon to indicate there is a potentialy complex expression. (Not shown in this example.)
More CDS Structure, and beyond
In this post we covered only a very simply view as a primer into S4Explorer Structure Diagrams. In a forthcoming post, we’ll do a deep dive where we’ll see more complex views, with more advanced structural features like UNIONs, JOINs, associations, GROUP BY-lists and more.
So far, we’ve seen how CDS Structure Diagrams give you quick insight into a single CDS Object. But what if you want to understand the interaction between CDS Objects?
Rest assured – features like the Dependency tree and the column lineage graph let you see these relationships in easy-to-read diagrams. However, this is a topic for another post. So stay tuned for a next edition of the S4Explorer feature highlights!
Finally
I hope this post helped you to understand S4Explorer’s CDS Structure Diagram. If you want to learn more about S4Explorer, then consider these resources:
- S4Explorer Smart Search – the first installment in the S4Explorer feature highlights series.
- S4Explorer Product Page – learn about the features, pricing, or schedule an appointment for a live demo;
- Youtube video of our SAP Tech Talk: “S4Explorer – A Clear View Into S/4 HANA”, hosted by Product Manager Gabriel Garcia Mayorca;